Tool: Behavior Data Dashboard
Found: Online only
This tool lets you see your results through an interactive platform.
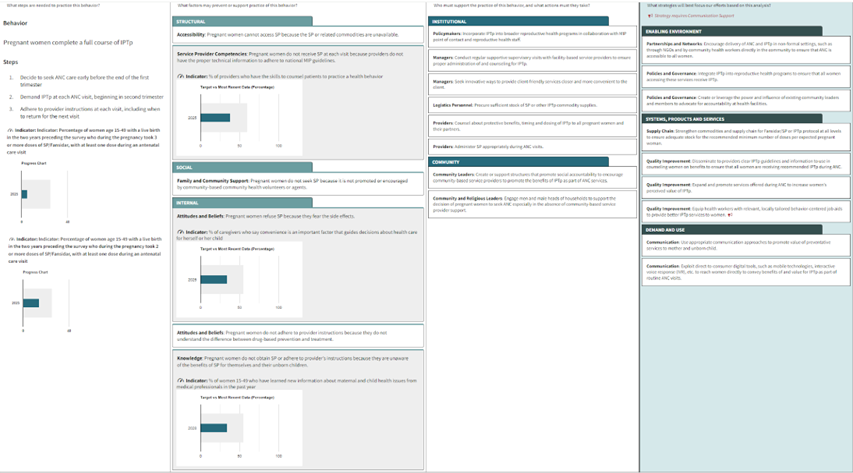
Our dashboard tracks changes based on data you have entered, or existing system data, at the national and sub-national levels (depending on data available) using trend lines and heat maps.
You identified your behavioral outcome indicators in Phase 1: Insight. If you have behavioral outcome indicators that are not in the system, you can add them in the custom data entry tool.
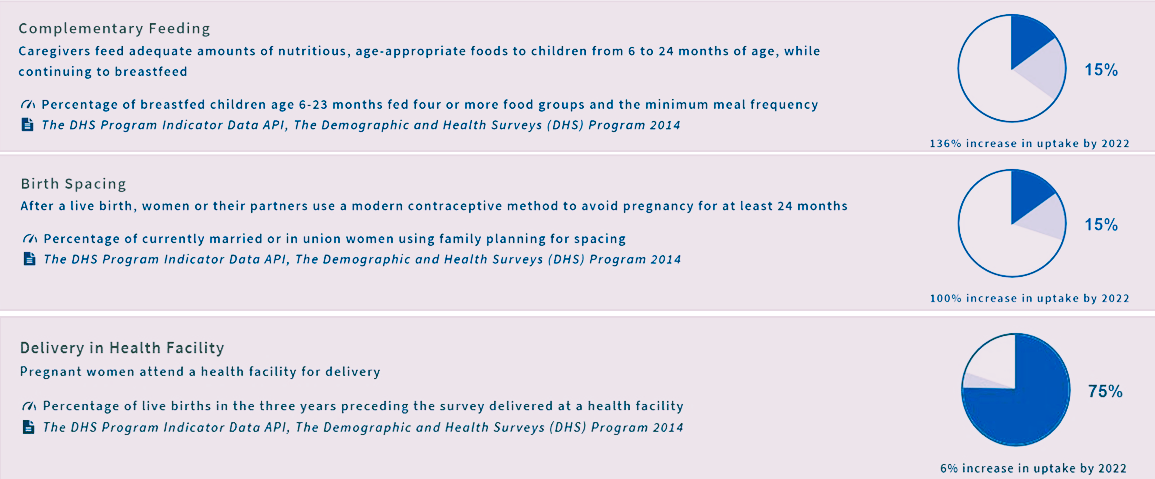
Once you have set your targets, quickly and easily jump straight to your Behavior Outcome Dashboard to see where your indicators stand and how you are doing on all of your priority behaviors.
As you update your data, your Dashboard will automatically update as well.
You can access the trend lines and country maps here too. And, for the 25 high impact health behaviors, the system provides performance indicator reference sheets to share with your monitoring and evaluation team.
 The Manoff Group was acquired by JSI in 2022.